The Effects of the Nessy Reading and Spelling Program Used in a General Educational Setting

View the case study white paper here.
Date: June 2017
The study documents a longitudinal comparison over 2.5 years from 2014-16, of a digitally delivered phonics program to a paper-based phonics program. 22 children from two different kindergarten classes were followed from the middle of their kindergarten year, until the middle of their second grade year. One class was given the Nessy individualized program guided by the computer, and another class was given Saxxon phonics, a paper based program delivered to the whole class by a certified teacher. The literacy development of all the students was monitored three times per year using the DIBELS 4 measure and compared to students within the same year groups in over 22,000 schools, in records held by the University of Oregon's Data System.
Could a digital phonics program (Nessy), delivered individually, ever compare in quality to a whole class teaching approach taught with traditional paper-based books and worksheets?
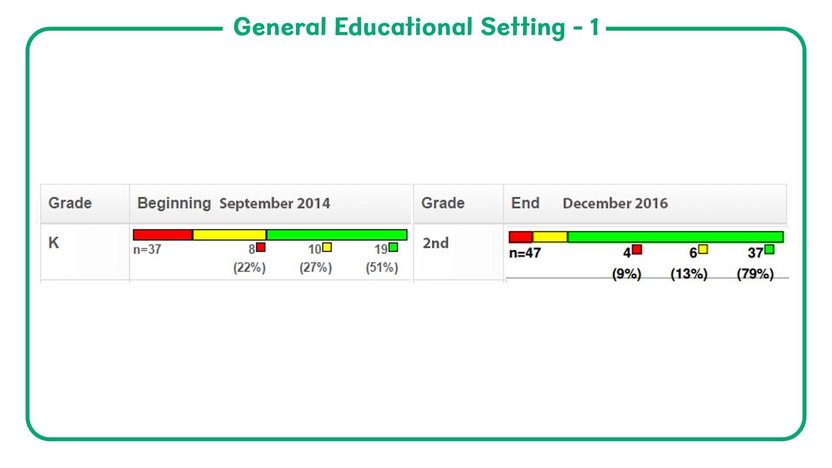
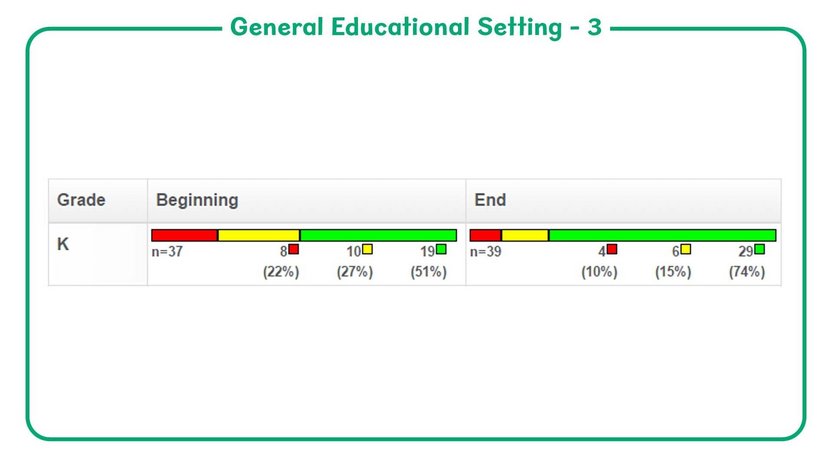
After instituting Nessy as part of the school’s reading program, called STRIVE, the number of kindergarten children reaching grade level benchmarks increased from 51% to 74% (green). The highest risk group (red), those that were struggling the most, decreased from 22% to 10%.
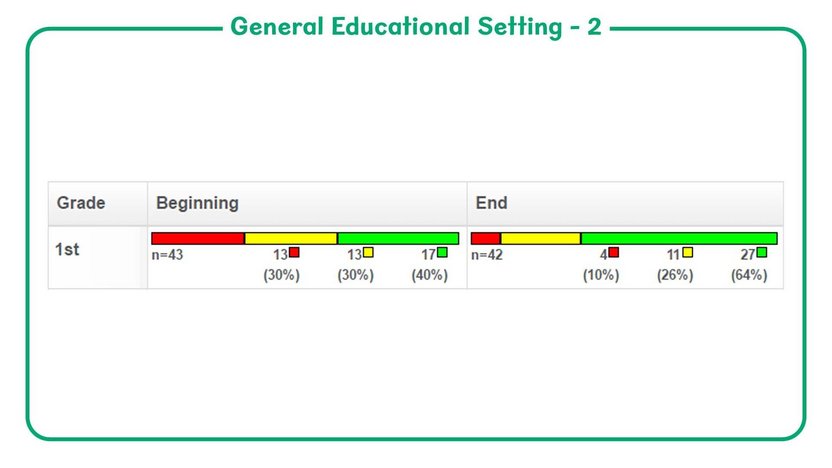
When 1st grade children were first assessed, 40% of them were meeting minimum grade level benchmarks. After instituting Nessy Reading & Spelling the number of 1st grade children reaching grade level benchmarks increased from 40% to 64% (green).
The students were followed for 2.5 years to see if this progress was maintained. Mid way through their 2nd grade year, 79% of these students were meeting grade level benchmarks.
This represents a growth of 31 percentile points placing these students in the top 10% of the national sample.
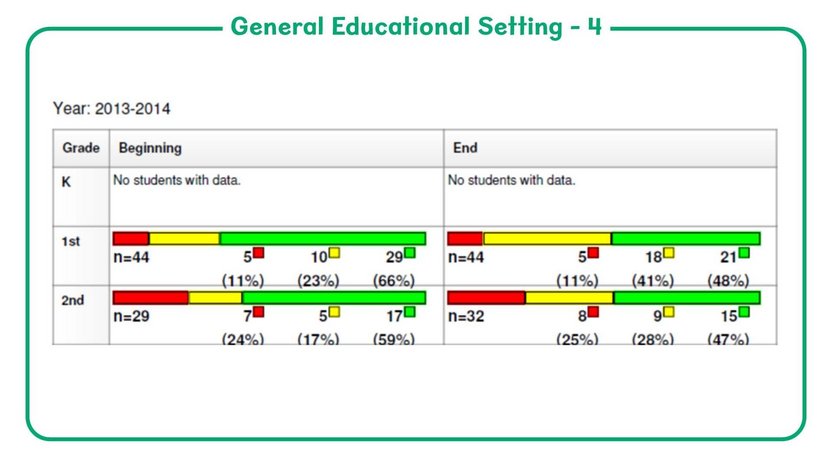
The paper based phonics program used a whole class approach led by certified teachers. At the beginning of the study 24% of students were identified as needing intensive support (red). This number increased to 25% at the end of one year's teaching. The number of students requiring support and falling below grade level expectations (yellow) grew from 17% to 28%. After 2.5 years, the number of students preforming at grade level (green) dropped from 59% to 47%.